

One of nowadays trends in math teaching is connection with information technology. In Czech Republic is new topic in education, which is named “Digital competence”. One of the applications, which we could use in Math, is Microsoft Excel.
In this article I will describe two activities, which could be done in Microsoft Excel
Combinatorics and probability
In Microsoft Excel there are three main functions, which could be used in Combinatorics:
- Variations
- Permutations
- Combinations
How to use these functions?
Example 1: We have got group of 20 students. We would like to select 3 different students – one for Math competition, second for Competition in English and third for Chemical Olympics. How many possibilities we have got?
We have 3 students for 3 different activities, it is Variation.
If we will count it, we could select one student for Math competition from 20 students, then we are selecting another one for English – but only from 19 students, and at last we must select one student for Chemistry – but from 18 students. If we will use rule of multiplication, we have:
20*19*18 = 6840
How to solve it in MS Excel? =PERMUTATIONA(20;3)

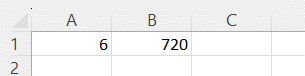
Example 2: We have group of 6 students, who will go to the lunch to school canteen. How many possibilities they could order to the queue for the lunch?
This problem is problem about ordering the group. It is typical example of permutations. This is solved by factorial.
6! = 6*5*4*3*2*1 = 720
How to solve it in MS Excel? =FACTORIAL(6)
Example 3: We have group of 10 people. They will greet by shaking hands one by one. How many shaking hands will be realized?
This situation does not depend on order. It is typical example of combinations. Every person from 10 people could shake hands with 9 other people. It is 10*9 = 90. But if A and B shake hands, it is the same that B and a shake hands. We must divide the solution by 2. It is 10*9/2 = 45
How to solve it in MS Excel? =COMBIN(10;2)

We could use these functions for some interactive tables, where we could compare different conditions.
Statistics
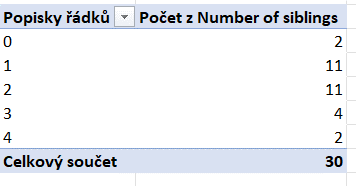
In statistics we have got measured statistical data. If we could have diagram, we could use Pivot table or pivot plot, in which we could summarize counts of every value.
As an example we have got the table from the questionnaire about number of siblings.

By pivot table we could make the table and the diagram.
Next we could use different functions to make statistical investigation. To process data.
- Mean() for average mean
- Mode() for mode
- Median() for median
- etc